The plight of the disabled graduate
Many of the systems designed to help students with disabilities disappear after they complete their education.

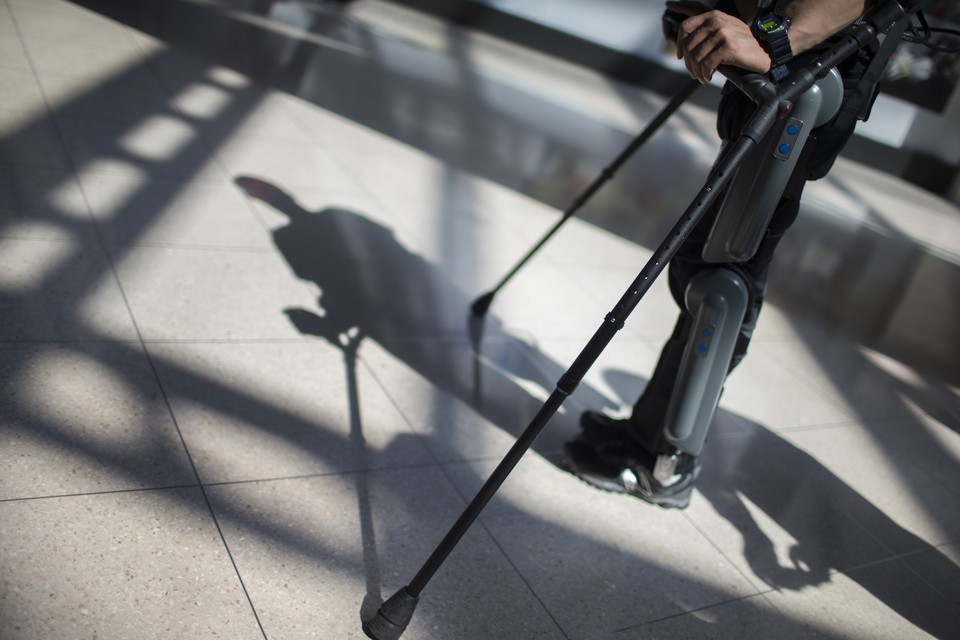
Photo Mike Segar, Reuters.
Mikhail Zinshteyn, The Atlantic June 4, 2015
The shift from high school to college, or from higher education to the workforce, is harrowing enough, but for the 6 million students diagnosed with a disability, the stakes are higher and the transition is all the more challenging.
That’s the big takeaway from Diplomas Count, Education Week’s annual spotlight on trends in high-school completion [in the United States]. This year’s package includes nearly 20 articles, student profiles, and data tools that dissect the major themes concerning students with disabilities as they consider what’s next after high school.
From weaker support systems on college campuses and workplaces, to pervasive misunderstandings about their specific needs, students with disabilities are often playing catch-up with the rest of the population. While improvements are underway to foster a more accommodating environment for those with disabilities like dyslexia or visual impairment, more can and should be done.
But some states stand out above others in their efforts to smooth the entry into higher education or the labor force for a student with a disability, serving as a model for others to put in place the programs and personnel experts say are needed.
To be clear, the nation has made major strides in providing an education for students requiring specialized support. As recently as the early 1970s, just one-fifth of students with disabilities were enrolled in public schools. Today, some 82 percent of students considered disabled are “mainstreamed,” Education Week notes, meaning they spend a substantial amount of instructional time in classrooms with students without disabilities.
Still, while the national high school graduation rate exceeded 80 percent in 2013, students with disabilities completed high school at a rate of 62 percent. The graduation rates vary by states: Mississippi and Nevada graduated less than 30 percent of their students with disabilities in 2013; Arkansas, Pennsylvania, and Texas graduated at least 75 percent of their disabled student population that year.
But even the higher graduation rates should be treated with caution. In a radio interview, Christina Samuels, the lead writer of this year’s Diplomas Count, said “How you define even a regular diploma for students with disabilities varies by state.” According to Samuels, in some states the graduation requirements are up to the “team of parents and teachers who develop a student’s individual education plan. You can take easier tests, [or] you can take no tests, you don’t have to take the same type of math or the same depth of math.” Troubling to her are not only are the lack of uniform standards but that sometimes students don’t even realize their diplomas were earned using an easier rubric.
Meanwhile, some of the rules that are in place to ensure students with disabilities are prepared to handle the rigors of life after high school are seldom enforced by states. One article in the Education Week package notes that federal law calls on schools to develop with students self-advocacy plans, which focus on their strengths, preferences, and interests. The article’s author, Sarah Sparks, writes, however, that a “2004 federal longitudinal study found only 3 percent of students with disabilities in general education classrooms were specifically trained to speak and plan for themselves.”
Once students with disabilities leave high school, the federal provisions meant to improve their chances of a secure livelihood change as well. The federal Individuals with Disabilities Education Act no longer applies to students once they graduate. And the federal laws for working adults or college students (Americans with Disabilities Act and Section 504 of the Rehabilitation Act) ask less of colleges and employers than the education law does of public schools. Schools that receive IDEA funds could do more, however, the U.S. Department of Education warned last year as it toughened its conditions for receiving a slice of the roughly $12 billion special-education program.
Samuels said in some ways it may be easier for a student with a visual impairment to secure the assistance she would need because her disability is more apparent than for a student with attention deficit disorder or an emotional disability.
“What we’re asking of students with disabilities is to really know themselves and to know what kinds of things they might need,” Samuels said. “If they think they can achieve the goals that they have set out for themselves, seeking out the extra assistance that might be available in that college atmosphere, that’s great, but there also needs to be an understanding of yeah, maybe I do need to have my professors know that I’m going to need certain accommodations.”
| This post appears courtesy of The Educated Reporter. |
| Mikhail Zinshteyn is a contributing writer for The Atlantic and a program manager at the Education Writers Association. |
![]() Source The Atlantic
Source The Atlantic
| Further reading |
Accommodating Learners with Disabilities in Post-Secondary Education in Alberta: A Review of Policies, Programs, and Support Services, Debra Russell PhD and Robin Demko BA. Alberta Innovation and Advanced Education, May 2005
Alberta Guidelines for Accommodating Students with Disabilities in Post-Secondary Studies, Learning Disabilities Association of Alberta, Edmonton, November 25, 2010
The Learning Team – A handbook for parents of children with special needs, Joan Alexander with Lorrie Goegan, Nancy Mackenzie and Carol Mairs. Alberta Innovation and Advanced Education, Edmonton 2003
An Analysis of Access Barriers to Post-Secondary Education, Angelo Vaccaro, College Quarterly, Fall 2012 Volume 15 Number 4. Seneca College of Applied Arts and Technology, Toronto.
Opening the Door: Reducing Barriers to Post-Secondary Education in Canada, Standing Senate Committee on Social Affairs, Science and Technology. Ottawa, April 4, 2012.
Also see
Diplomas Count 2015: Report and Graduation Rates Education Week, United States
